
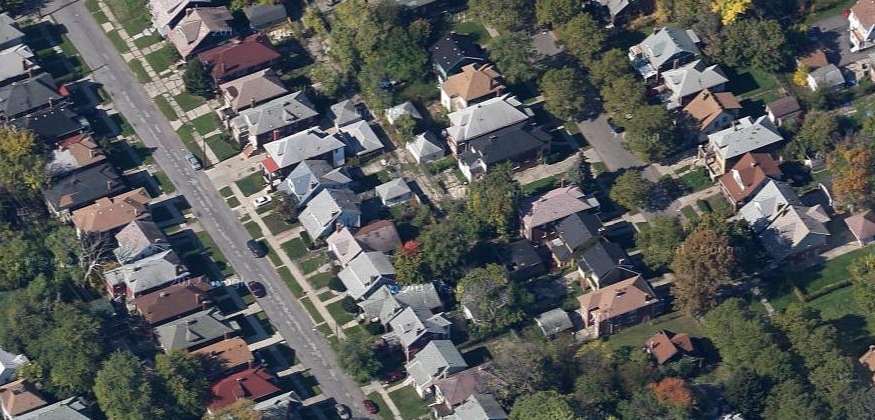
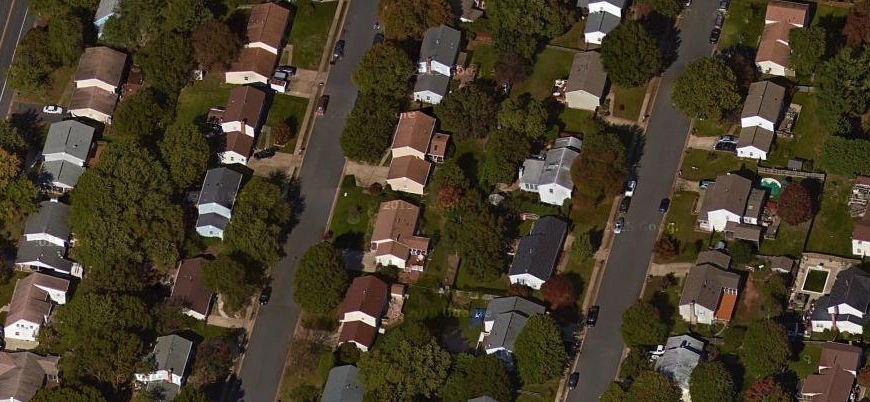
As Let's Go LA wrote in a must-read post from a couple years back, however, there is a great variation in patterns of urbanization in various regions of the US. While some parts of the country do feature land-intensive residential development, other areas are very compact. I tried to address the reasons for these differences in a post from late last year, speculating that lot size on the city fringe, in the contemporary American context, is mainly a product of 1) agricultural land values and 2) availability of groundwater, which allows housing to be built (typically at low densities) in the absence of city sewers. In areas where the value of land for agriculture is lower yet groundwater is abundant, such as the Southeast US, very large lot sizes are observed. In inland California, by contrast, where the climate and soil are optimal for high-value agricultural products and water is more scarce, cities are highly compact and lot sizes are small.
 |
| Compact Tulare, California, compared to Tuscaloosa, Alabama. |
- European: Appreciation of agricultural land for its cultural/aesthetic heritage, as reflected, for instance, in Britain's Town and Country Planning Act of 1947. The notion of rural land as a public resource is also reflected in freedom to roam laws, which are largely unknown in the US. Farming is heavily supported by the Common Agricultural Policy, which provides funds directly to small farmers rather than price supports for commodities, to the extent that land which would otherwise revert to forest or be sold for development is kept in agricultural production. The appearance of compact European towns of tile-roofed houses dotted among crop fields and pastures is no accident, and instead is the result of public policy determined to "curate" legacy farm landscapes.
- American: Appreciation of dramatic wilderness landscapes with little or no evidence of human habitation, as reflected in the aesthetics of the Hudson River School of painting (not to mention Bob Ross) and, currently, in the US national park system. Agricultural land, with a few major exceptions (see Lexington, KY), is generally not given significant, independent aesthetic or cultural value that is recognized in public policymaking. Although loss of agricultural land is often mourned, few states or cities have policies that address the subject in a coherent and comprehensive way.

At left, Thomas Kinkade; at right, Bob Ross, embodying the "cabin in the woods"
aesthetic that is still influential in much of American thinking on housing.

The European policy on agriculture is directed more at preserving farmland and subsidizing employment in agriculture, among other purposes, than it is in restricting the low-density spread of the automobile-based town or city, but the one is merely the flip side of the other. In the absence of the limitations described above (high agricultural land values and scarce water), the condition often referred to as "sprawl" -- which I would prefer to spell out concretely as a leapfrog-like pattern of land-intensive, pod-like, low-density development -- seems to be a common condition in the context of high car ownership.
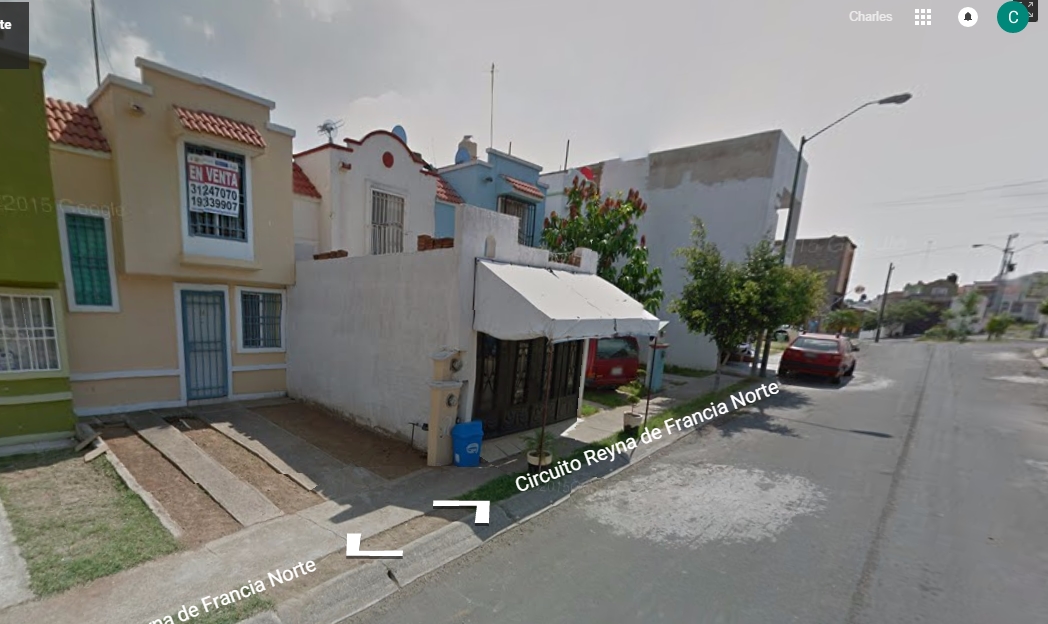
 |
| French villages and agriculture, south of Paris. From Google maps. |
The influential American environmental movement, on the other hand, has left little doubt as to the landscapes it favors protecting. The Sierra Club's website doesn't seem to have any recognition of agricultural land, instead focusing almost entirely on wilderness, although most true wilderness is not under threat of urbanization. The Nature Conservancy does mention agricultural land, but as a potential threat to natural resources. Although many of the goals of these organizations are important and praiseworthy, the focus on nature, rather than the agricultural landscape, undermines their position with respect to urban policy and planning. The Sierra Club has recently come under criticism in urban circles for appearing to support exclusionary zoning in certain contexts, while the Nature Conservancy's urban affairs expert seems to be at pains to make the case for dense urbanism to a skeptical audience.
I mention these examples, though, to reinforce the contrasting visions above. The American imagination has traditionally been drawn to wild spaces rather than to the symbiosis between food and land (represented in the French term terroir). Although the notion of locally-sourced food products has lately gained some traction, this has not translated into much if any public policy, and has has further been confused by cheerleading for the oxymoronic "urban agriculture" (although the very idea of local and/or urban agriculture could be interpreted as a pining for a sort of terroir). A few New Urbanist developments have emphasized the connection between agriculture and urbanism, such as Serenbe in the outer reaches of Atlanta, but these are few and far between and have not been above criticism. Local land trusts have embraced preservation of agricultural uses, but these organizations lack the scale necessary to guide policy at the regional level.
None of this is to argue that the United States, or any other country, would necessarily benefit from European-style agricultural regulations. What may be worth exploring, though, is the questions of how agricultural economics affects urban form, and to consider how public policy in this area relates to goals for urban development. Being the focus neither of urbanists nor environmentalists, agriculture has largely escaped significant land-use scrutiny in the United States. It deserves more attention.


